| Name | Date | Size | ||
|---|---|---|---|---|
| .. | 25-Jul-2019 | 158 | ||
| add.log | H A D | 25-Jul-2019 | 238 | |
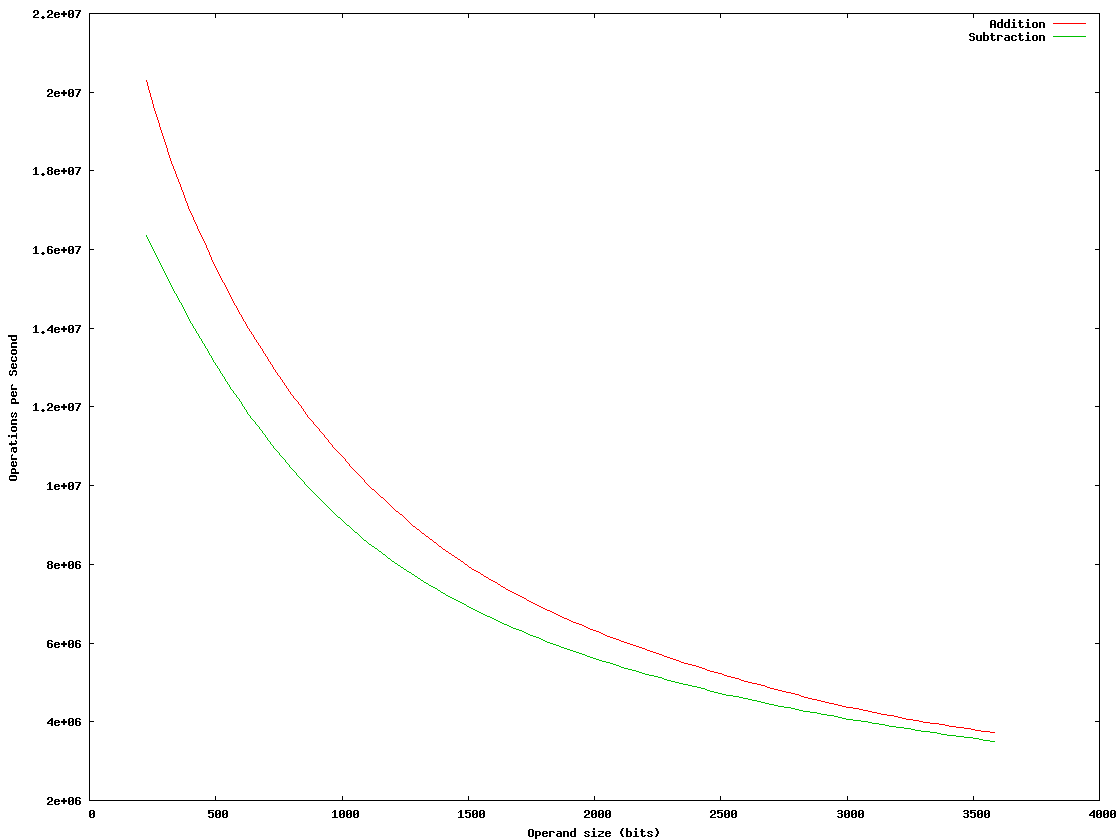
| addsub.png | H A D | 25-Jul-2019 | 6.1 KiB | |
| expt.log | H A D | 25-Jul-2019 | 103 | |
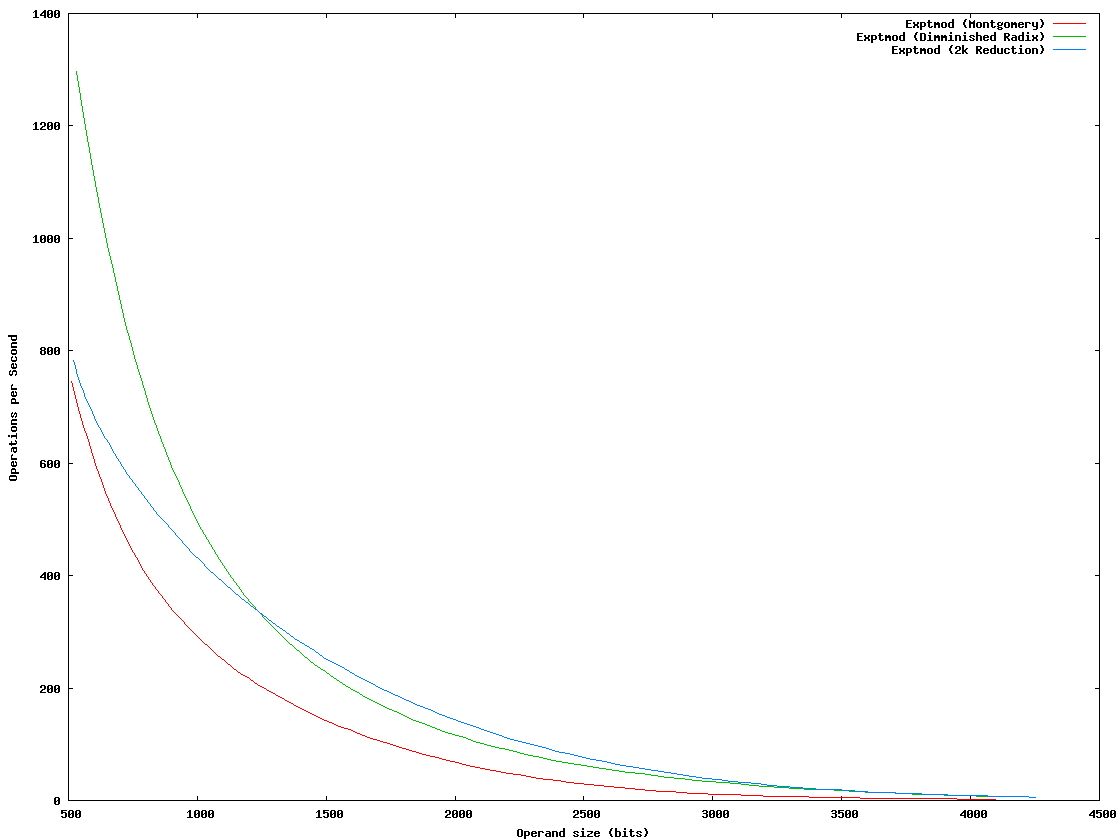
| expt.png | H A D | 25-Jul-2019 | 6.5 KiB | |
| expt_2k.log | H A D | 25-Jul-2019 | 74 | |
| expt_2kl.log | H A D | 25-Jul-2019 | 59 | |
| expt_dr.log | H A D | 25-Jul-2019 | 103 | |
| graphs.dem | H A D | 25-Jul-2019 | 786 | |
| index.html | H A D | 25-Jul-2019 | 467 | |
| invmod.log | H A D | 25-Jul-2019 | 0 | |
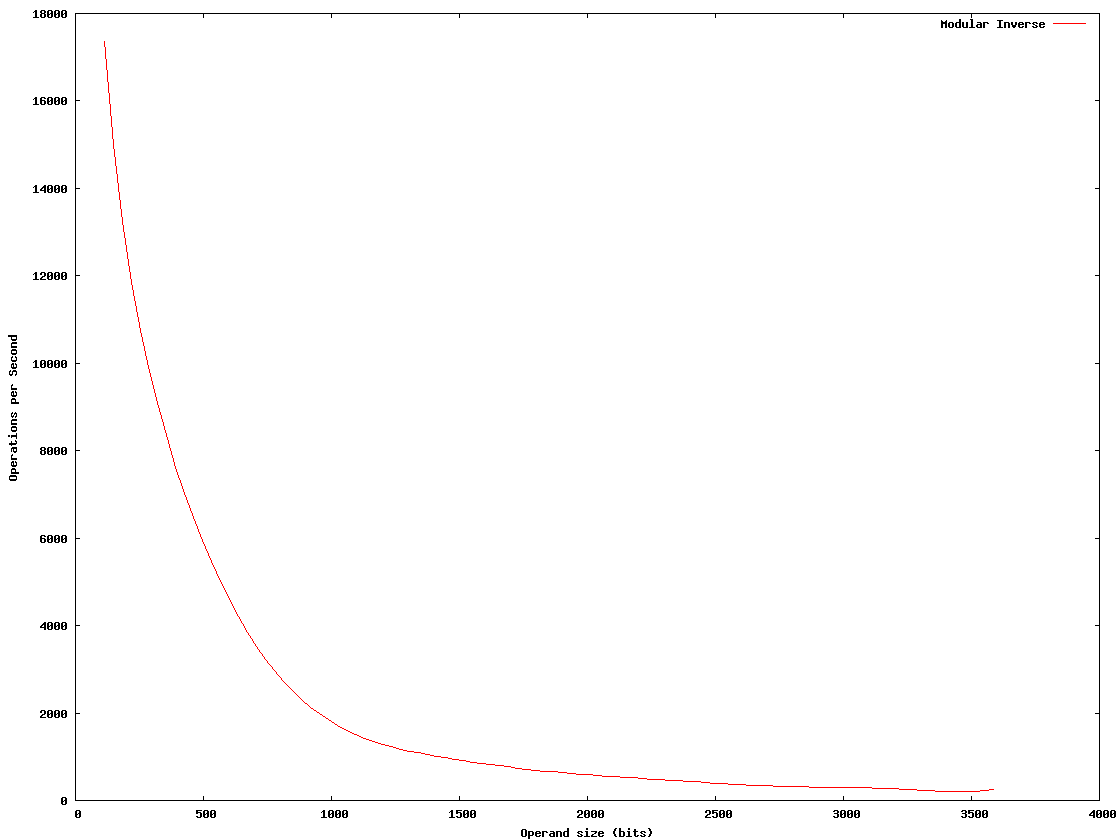
| invmod.png | H A D | 25-Jul-2019 | 4.8 KiB | |
| mult.log | H A D | 25-Jul-2019 | 1.2 KiB | |
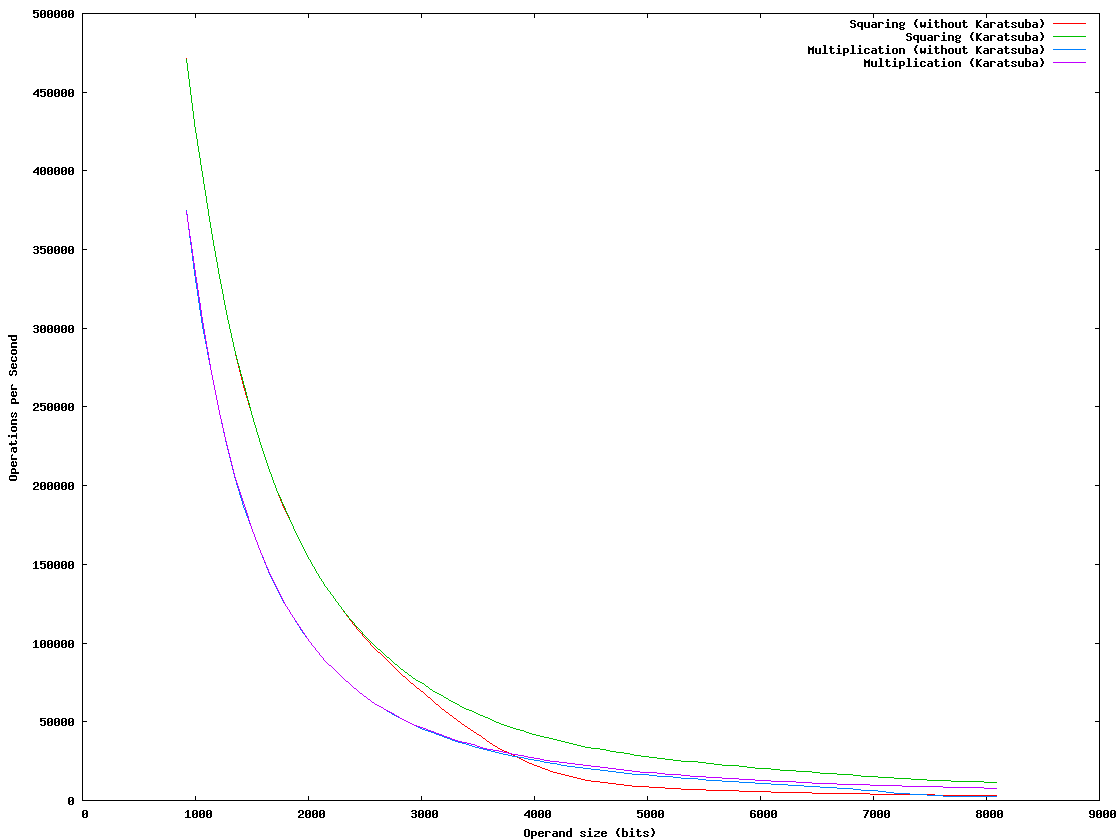
| mult.png | H A D | 25-Jul-2019 | 6.6 KiB | |
| mult_kara.log | H A D | 25-Jul-2019 | 1.2 KiB | |
| README | H A D | 25-Jul-2019 | 428 | |
| sqr.log | H A D | 25-Jul-2019 | 1.2 KiB | |
| sqr_kara.log | H A D | 25-Jul-2019 | 1.2 KiB | |
| sub.log | H A D | 25-Jul-2019 | 238 |
README
1To use the pretty graphs you have to first build/run the ltmtest from the root directory of the package. 2Todo this type 3 4make timing ; ltmtest 5 6in the root. It will run for a while [about ten minutes on most PCs] and produce a series of .log files in logs/. 7 8After doing that run "gnuplot graphs.dem" to make the PNGs. If you managed todo that all so far just open index.html to view 9them all :-) 10 11Have fun 12 13Tom